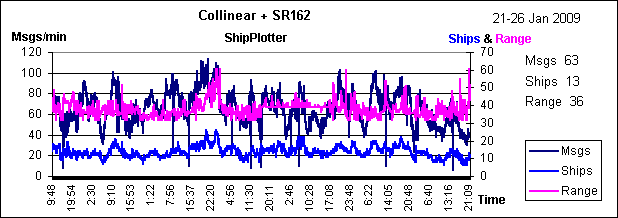
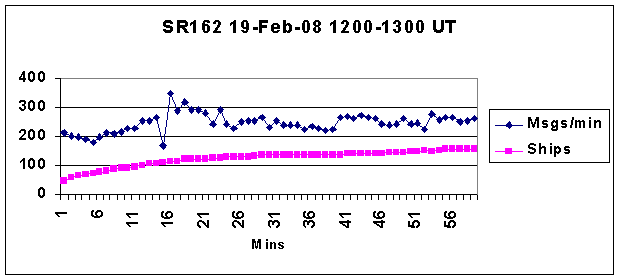
Actual Performance Comparison of SR162 with Comar AIS-2-USB
Occasional dropouts on top graph are caused by ShipPlotter stalling
because a server it is uploading to is stalling. This PC is using
ShipPlotter to upload to 5 servers. The other PC running the second
graph is not feeding data to any server.
You can download the spreadsheet that
will produce these graphs automatically (if ShipPlotter is running).
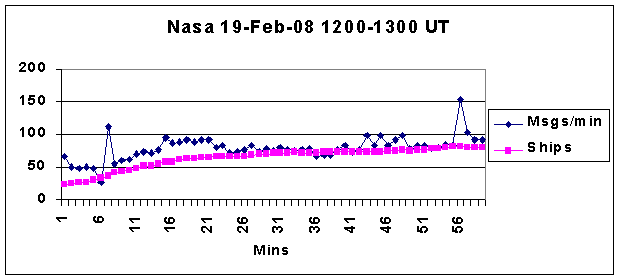
Actual Performance Comparison of SR162 with Nasa AIS Engine
How was it done ?
Both receivers were fed simutaneously with the same signal from the
same aerial.
A passive (non frequency dependant) 50 ohm splitter was used.
The splitter will degrade the signal in both recievers by a minimum
of 3dB (halved).
Each receiver was connected to separate PC's running ShipPlotter.
The ole/com interface drove an identical vbs script on each PC,
dynamically using Excel to draw the graphs..
ShipPlotter was purged immediately prior to starting the vbs script.
At the end of 60 mins the graph was saved, and a screen image
captured.
I'll let you draw your own conclusions.
You can download the spreadsheet that
will produce these graphs automatically (if ShipPlotter is running)
without using vbs.
Notes
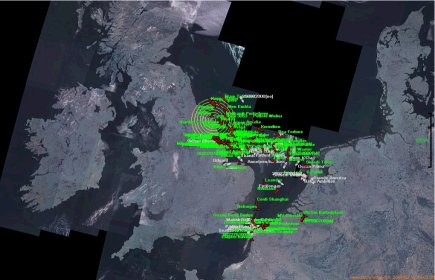
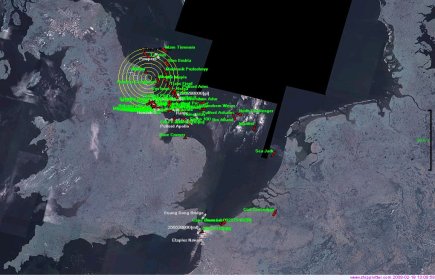
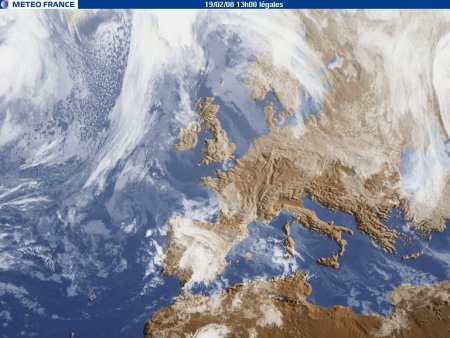
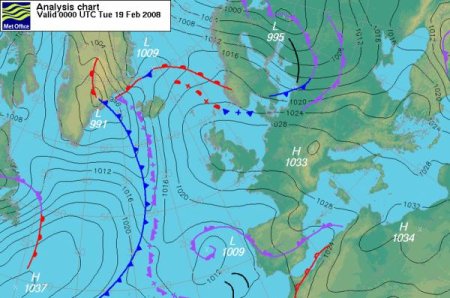
Propagation was exceptionally good due to the high pressure over
Europe.
The range rings are set at 50 miles maximum.
Ships are "the total number of active ships (that would appear on
the chart)".
Grey Ships was set at 10, and Omit Ships was set at 30
Msgs are as the counter at the bottom of the ShipPlotter screen.
The large blips on the graphs are probably caused by ShipPlotter
buffering the messages while waiting on the sharing servers.
Link to my
AIS Collinear Aerial Page & VHF horizon Page & AIS Receiver Comparison Page & Graph Plotter Page
See also Beyond
the
Horizon Propagation
